Pythia
demoForecasts daily trading volume for a market making desk, so staffing and capacity get sized ahead of demand instead of guessed at.
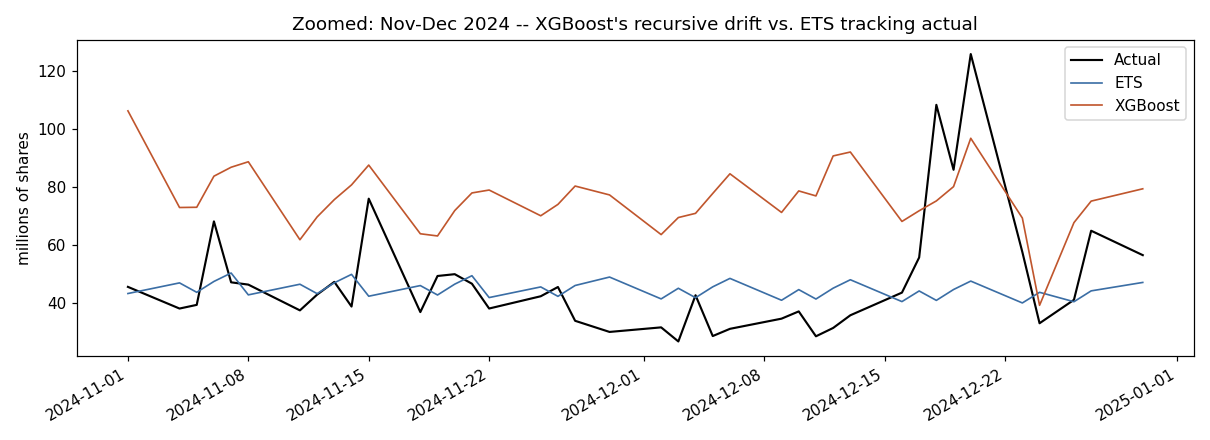
View source on GitHubSeasonal naive and ETS baseline, Prophet, and XGBoost on lag and calendar features, validated with walk forward folds and a six month holdout. ETS shipped: XGBoost wins short horizon validation, then drifts on the holdout because it forecasts recursively and compounds its own error.
Prediction intervals come from 1,000 bootstrap simulated paths through the fitted model, not a fixed padding. FastAPI serves /forecast, containerized with Docker, built and run end to end. The demo above is a static render of the shipped model's output, not a live backend call.
Results
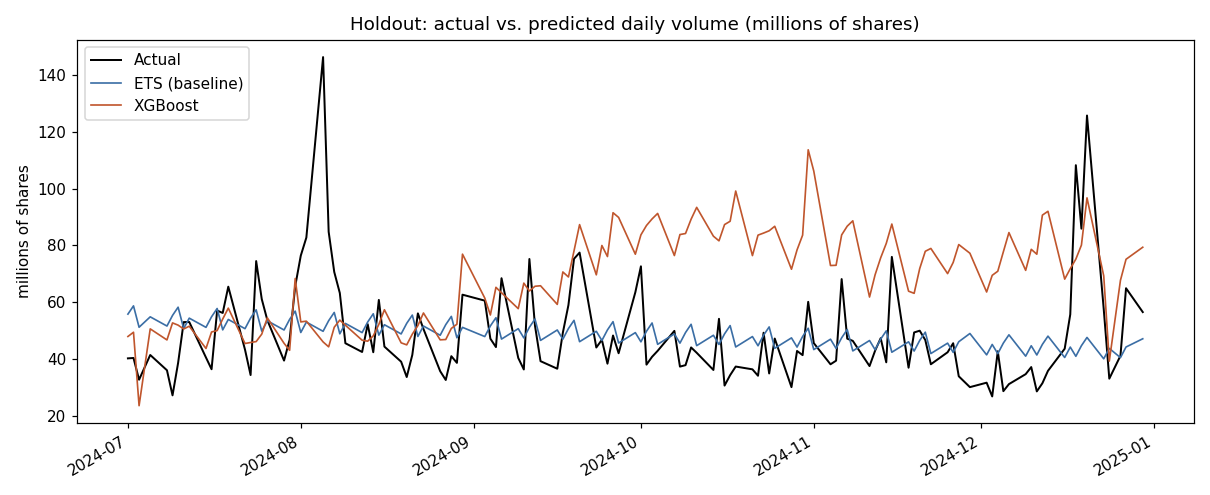
Four models compared two ways: walk forward validation inside the training window, and a single untouched six month holdout that includes the August 2024 volume spike. The ranking flips between the two, which is the actual finding.
| Model | Holdout RMSE | Holdout MAE | Holdout MAPE |
|---|---|---|---|
| Seasonal naive (baseline) | 23,298,645 | 17,390,910 | 34.66% |
| Prophet | 22,748,817 | 16,866,131 | 33.51% |
| XGBoost, lag and calendar features | 31,330,599 | 25,482,660 | 60.71% |
| ETS (deployed) | 18,431,843 | 12,789,919 | 25.94% |
XGBoost wins every metric on walk forward validation (23.91% MAPE, best of all four), then becomes the worst model on the holdout. It forecasts recursively, feeding each day's prediction back in as the next day's lag feature, so small early errors compound over a six month horizon. ETS and Prophet extrapolate an explicit trend instead of re-deriving the future from their own output, so they hold up better at the horizon a capacity planning tool actually needs.